MCPS Interactive Boundary Explorer


Welcome to the MCPS Interactive Boundary Explorer (IBE)! This platform was developed to give the MCPS community an opportunity to interact with the data being analyzed as part of the Districtwide Boundary Analysis, and add their voice to the process. On the IBE, you can get context about this analysis, explore the data yourself using the interactive tool, and add your voice to the process using the survey.


This website is the main vehicle for collecting public feedback and insights during Phase 2 of the Districtwide Boundary Analysis. After spending time exploring this website, please take 10-15 minutes to fill out the survey.


The input gathered through this survey will be analyzed and included in the final report to the Board of Education. To make sure your response is counted in the final report and analysis, please fill out the survey by December 1, 2020. Note: the survey will remain online through the end of the year.


To learn more about the engagement activities happening around the IBE, click here.


What will I find here?

A quick overview of the Three Lenses used in this analysis.

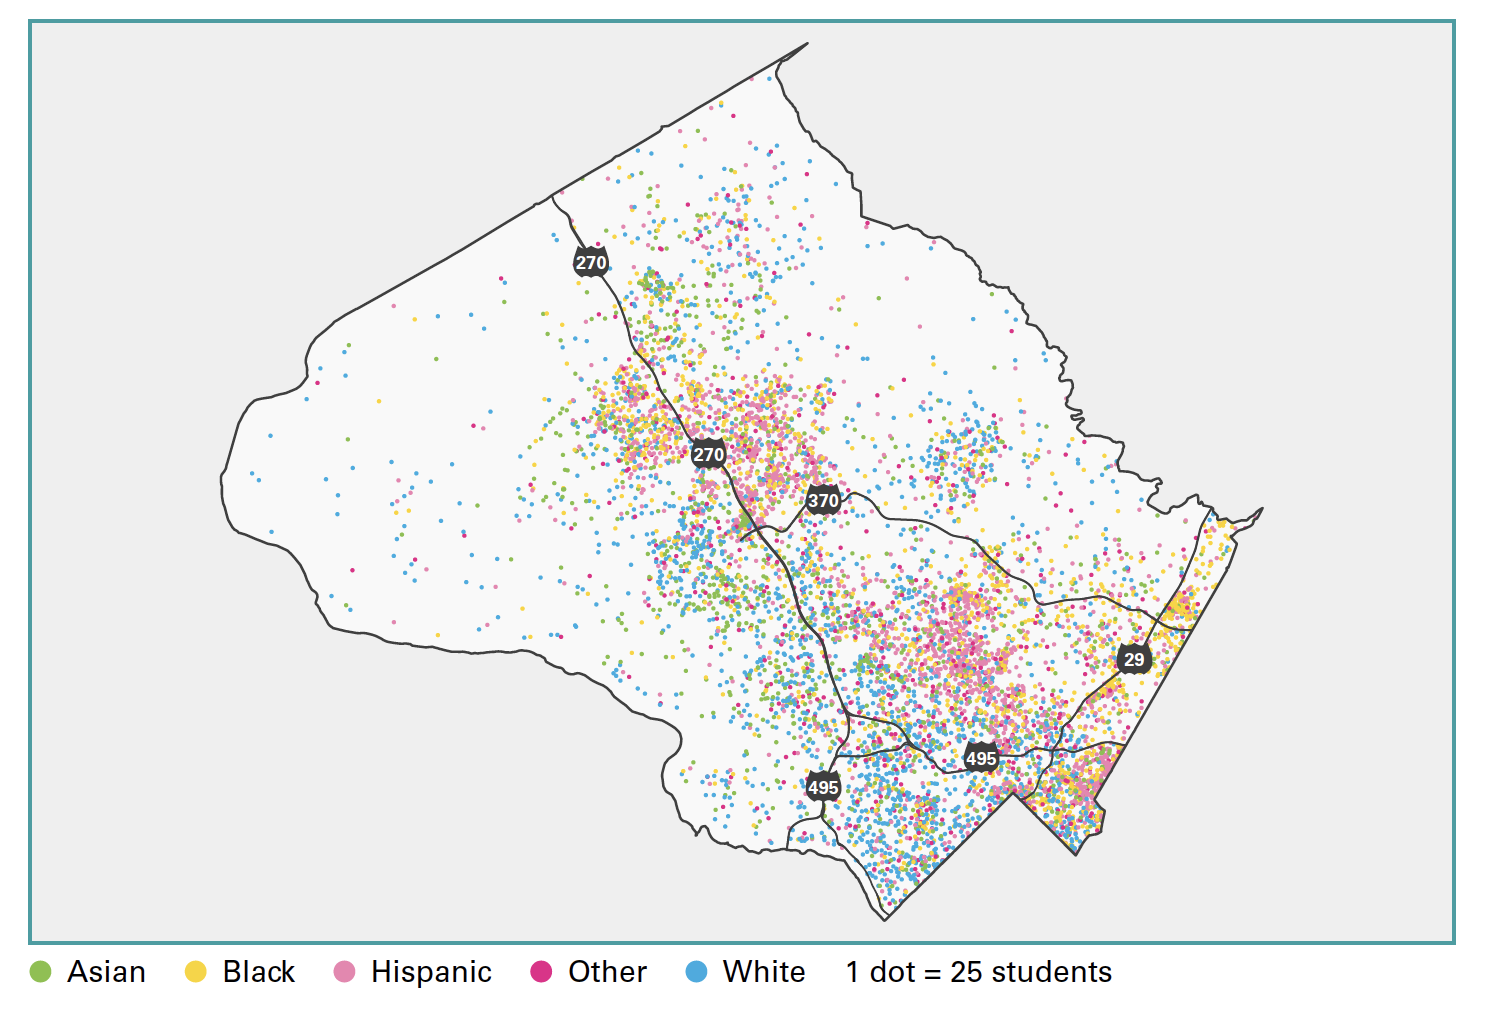
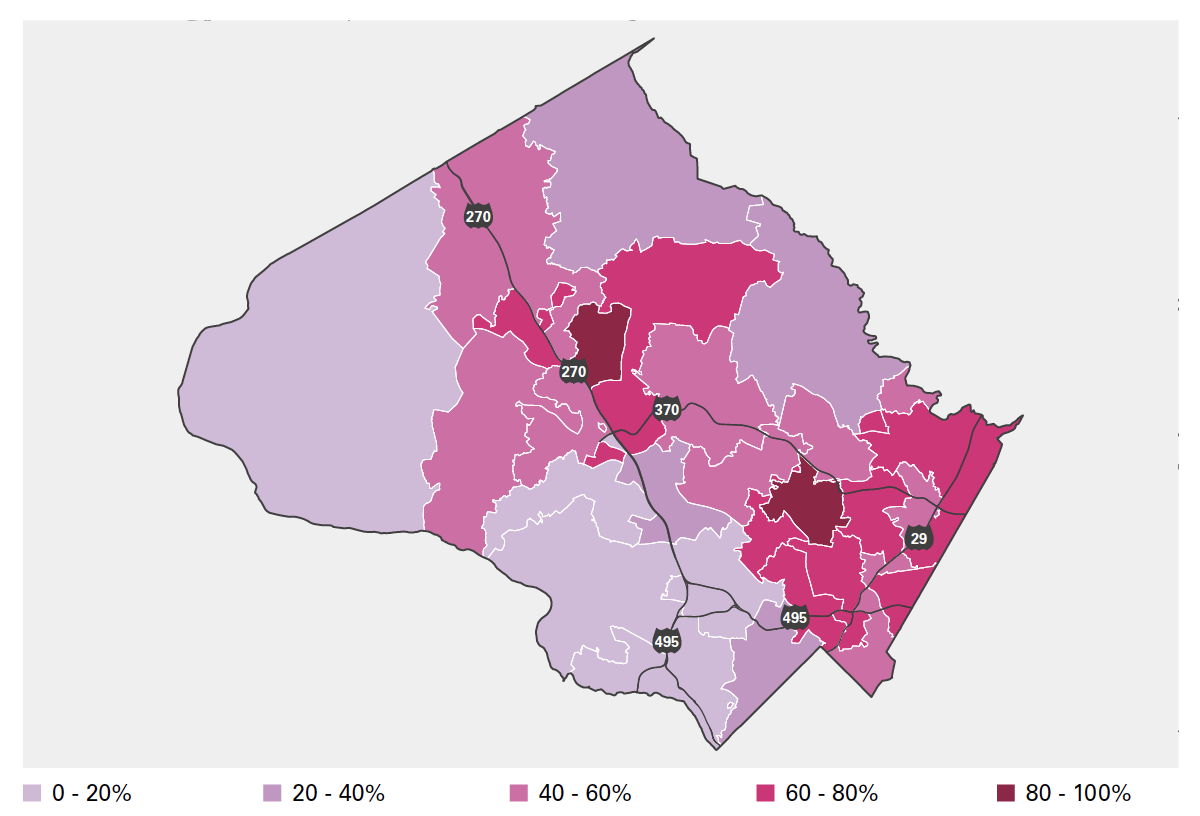
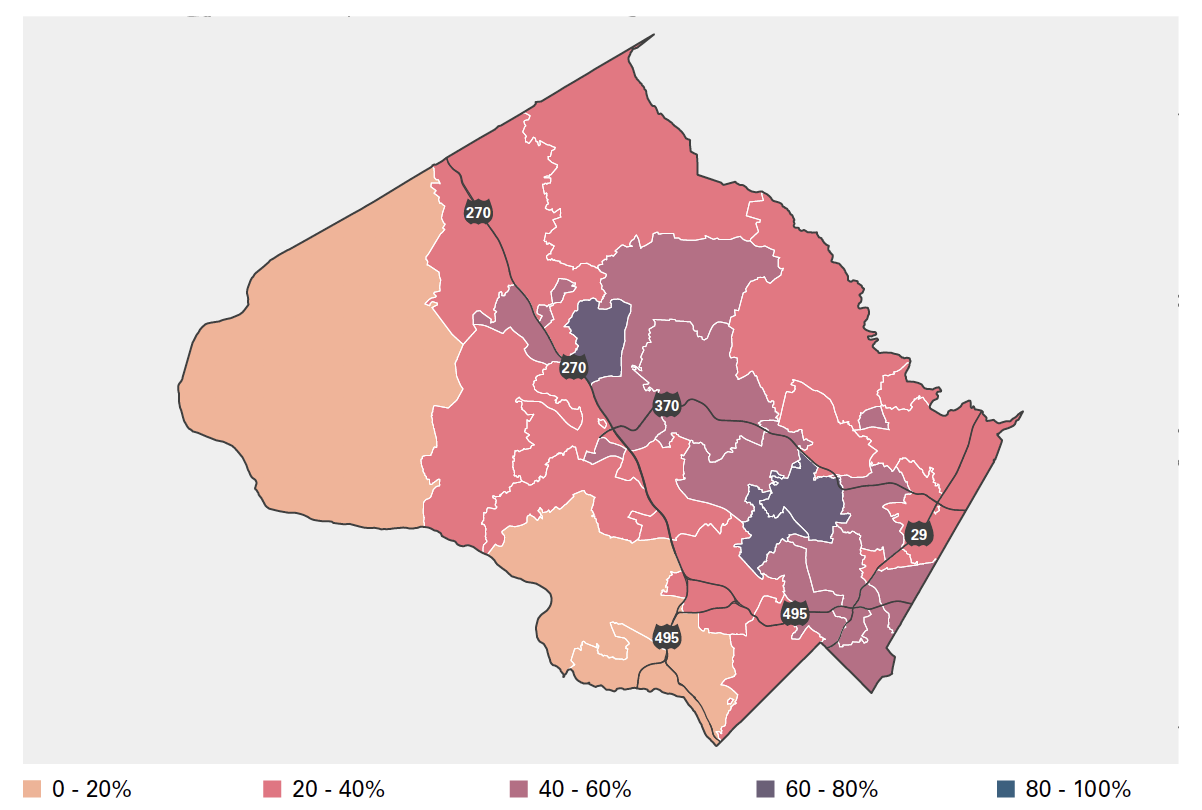
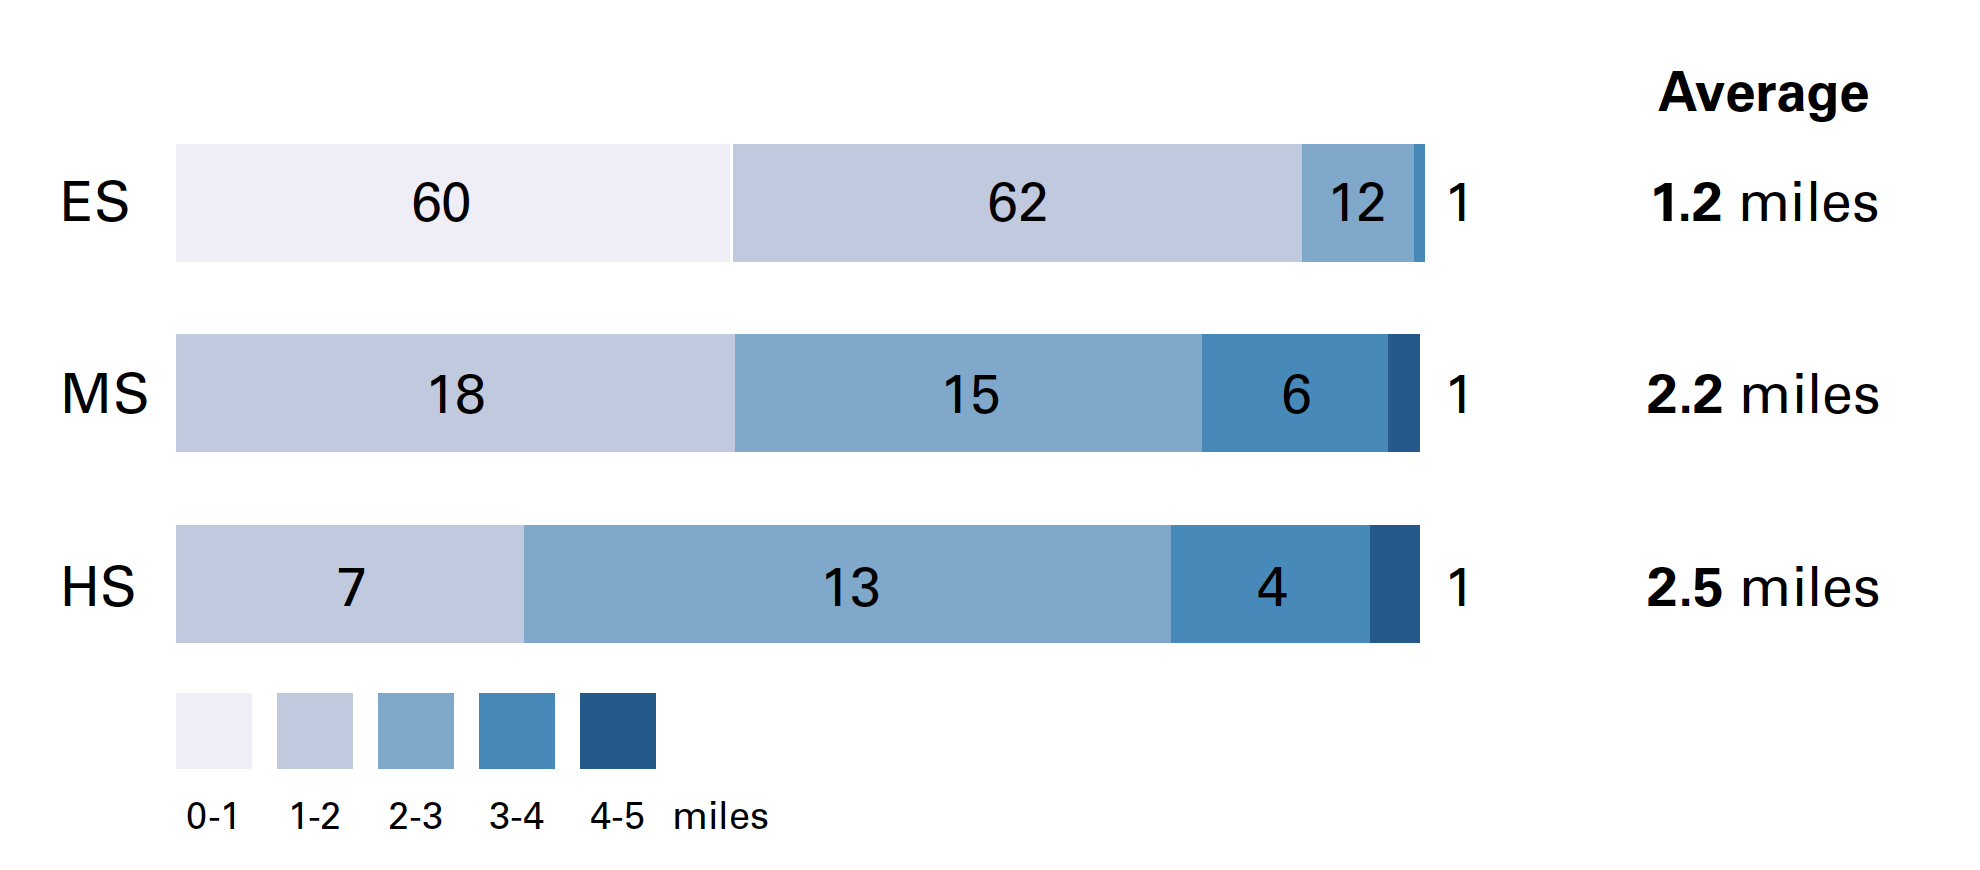
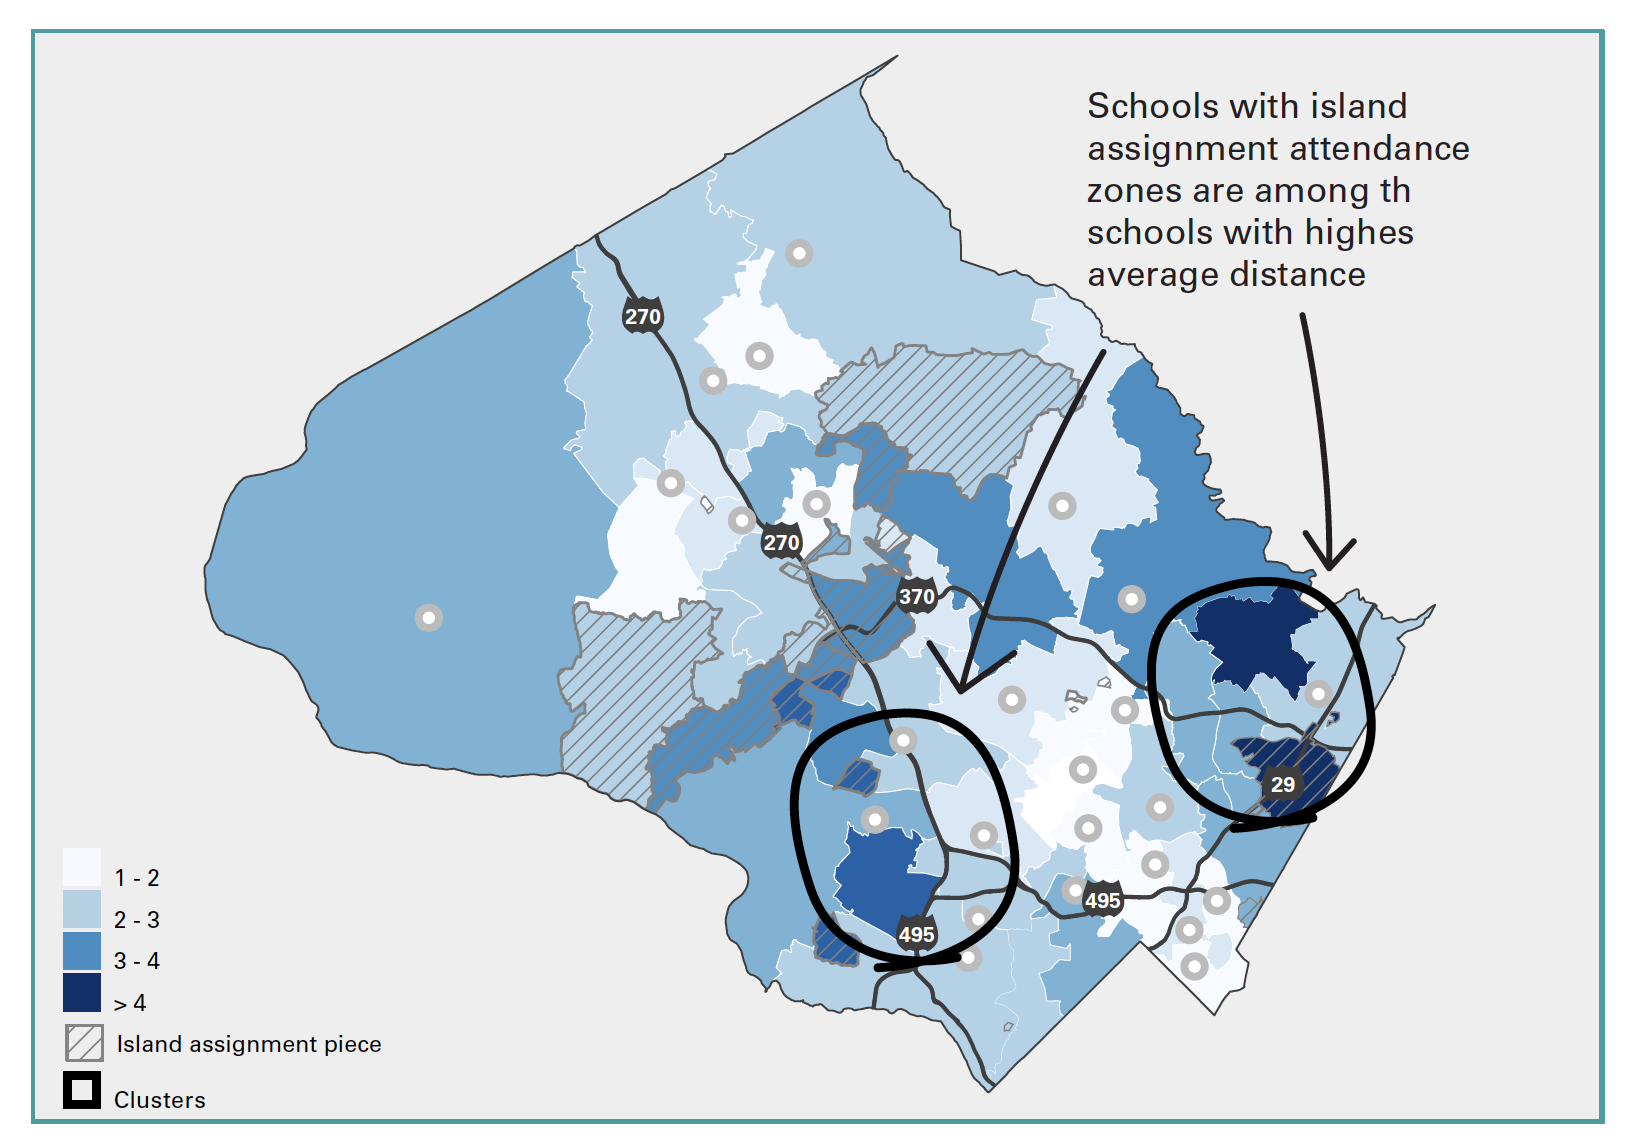
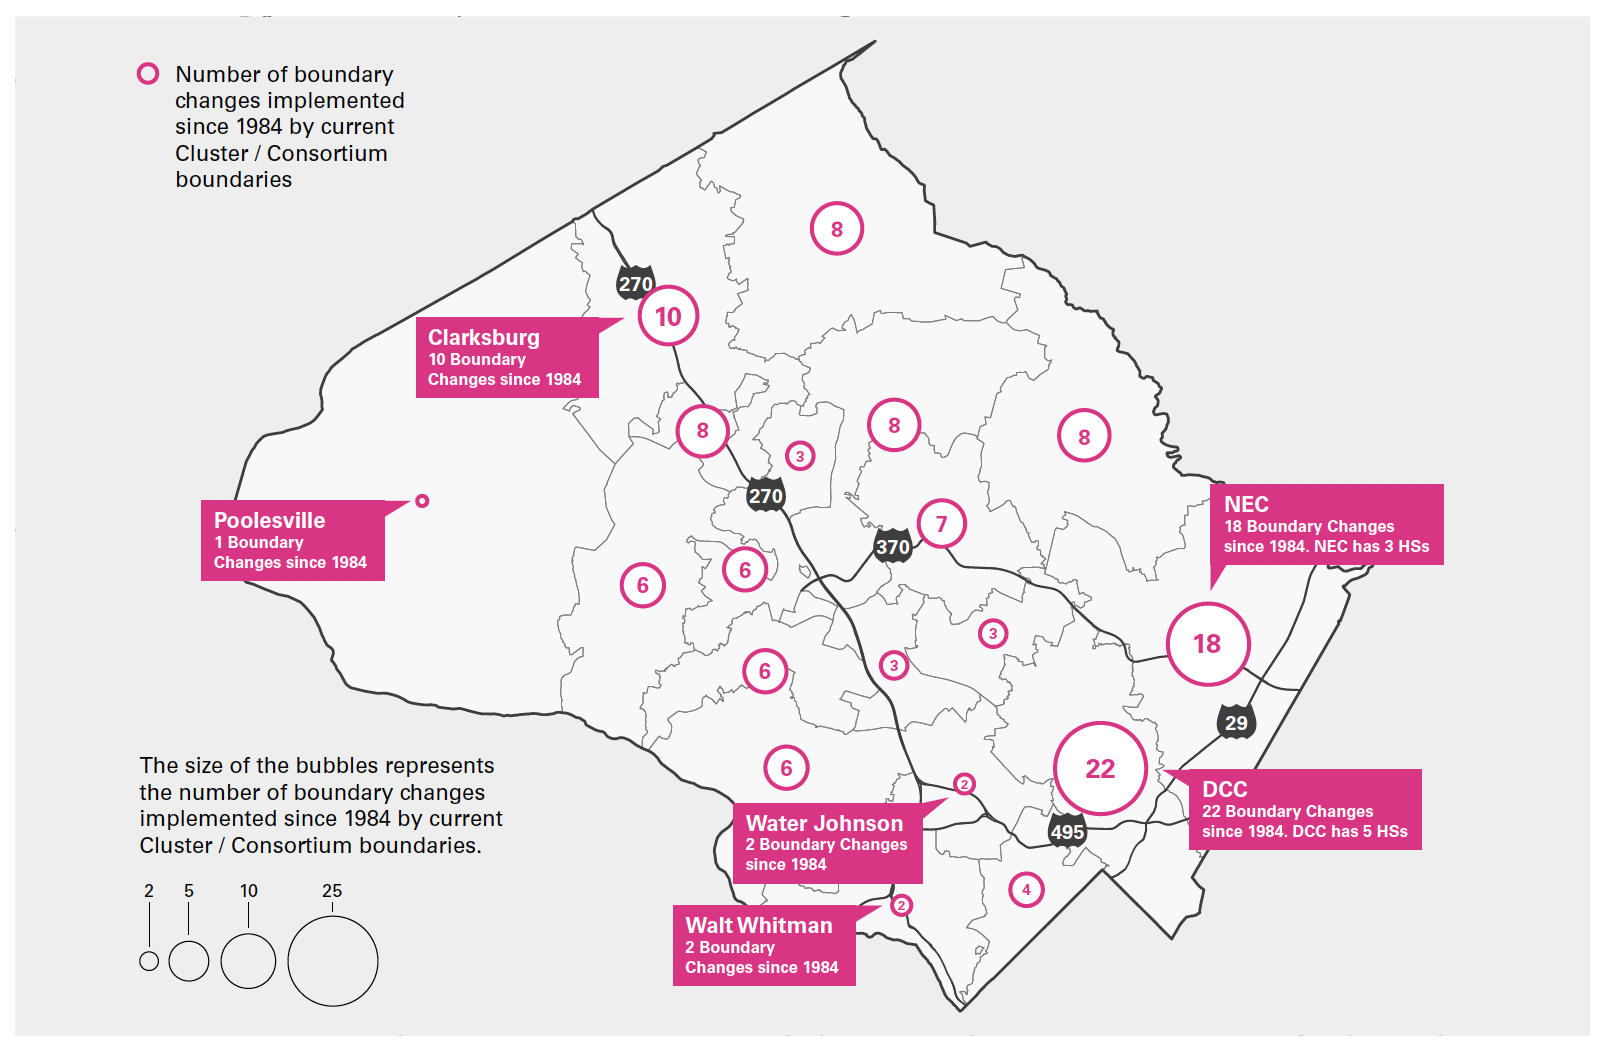
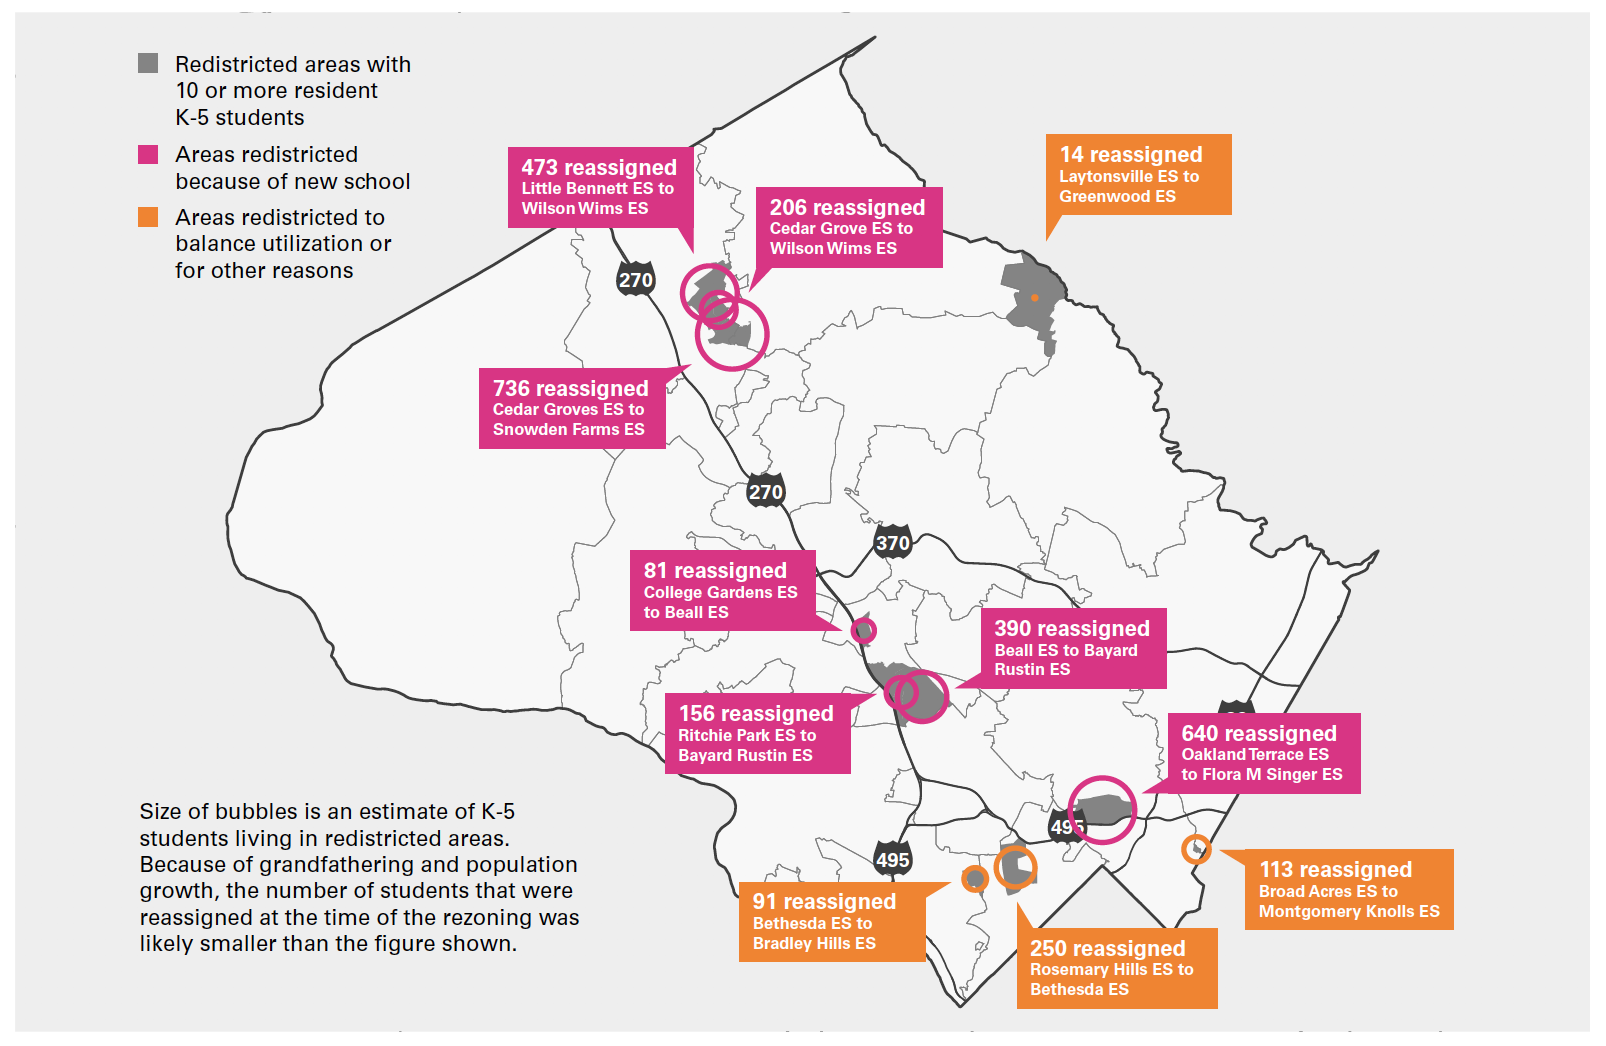
Key Insights drawn from the analysis, in figures and graphs.

An Interactive Tool to compare data at school, cluster, and county levels.

A Survey to engage with us during Phase II of the Boundary Analysis.

TAKE THE SURVEY!


Thank you for taking the time to explore the Interactive Boundary Explorer! To add your voice to the boundary analysis process and make sure your input is included in the final report to the Board of Education, please set aside about 15 minutes to take part in this online survey.


Pointers

The goals of the MCPS Boundary Analysis are:


The purpose of the boundary analysis is not to redraw school or cluster boundaries, but rather to examine existing conditions.

The Three Lenses for Analysis

Differences in facility utilization, diversity, and proximity across the county means that students have varying experiences of school quality across the district.


UTILIZATION

Utilization measures the capacity of school facilities. This is calculated by comparing student enrollment to a school’s total available seats. Utilization is important for maintaining reasonable class sizes and accommodating growth.

DIVERSITY

Diversity refers to differences between students. It is measured here by three factors: race and ethnicity, socio-economic background, and English language proficiency. Key measures include racial dissimilarity, Free and Reduced Meals System (FARMS) eligibility and English for Speakers of Other Languages (ESOL)

PROXIMITY

Proximity considers the difficulty or ease with which students get to school. This analysis considers miles traveled to school (using road distances) and the proportion of students who attend the school closest to their home or live within their school’s walk zone.

Key Insights

Toggle between the lenses to read important findings from each of their analyses.


Getting Started

This interactive tool was designed for community members to understand and engage with data related to utilization, diversity, and proximity of schools in MCPS. Use these help videos and exercises to begin exploring the tool!


Just the Basics

Tool Orientation

How to Search Your School and Read the Summary Table

How to Compare Schools

Diving Deeper

How to Explore Countywide Data

How to Use Filters

How to Use a Scatterplot